Did you know that data science and analysis positions are often the hardest ones for a company to fill?
Thanks to exploding demand for data professionals, there are a ton of open data analyst jobs, and not enough candidates to fill them.
Translation? Data analysis is an exciting field to get into and the career prospects are amazing. 👀
Now, just to clear up a common misconception right off the bat: you don’t need to be a math/computer science/coding whiz to learn data analysis or land a job.
But how do you know if data analysis is something that might interest you? And how can you start learning data analytics and begin a career if you have no background in it?
In this sponsored introduction to data analysis with Udemy, we’ll tell you everything you need to know about getting started with data analysis.
What is data analysis? Why is data analysis important? What possible data analyst jobs are available in the field? How can you start to learn data analytics and figure out what tools and data analysis skills you’ll need to land a job? What data analysis courses for beginners are out there?
Let’s jump right in!

Disclosure: This post is sponsored by Udemy and I’m also an affiliate for them. If you buy a Udemy course through the links on this page, I may get a small commission for referring you. Thanks!
What Is Data Analysis?
First things first: what IS data analysis?
➡️ In short, data analysis involves sorting through massive amounts of unstructured information and deriving key insights from it. These insights are enormously valuable for decision-making at companies of all sizes.
According to Ben Collins, spreadsheet developer, data consultant, and data analytics instructor, “It actually really just boils down to one key job — which is to gain insights from all this data we have.”
A quick note here: data analysis and data science are not the same. Although they belong to the same family, data science is typically more advanced (a lot more programming, creating new algorithms, building predictive models, etc.).
Becoming a data analyst can open the door to lucrative careers like data science and data engineering (just to name a few) as you gain more experience on the job.

An introduction to the data analytics process:
- Define the question or goal behind the analysis: what are you trying to discover?
- Collect the right data to help answer this question.
- Perform data cleaning/data wrangling to improve data quality and prepare it for analysis and interpretation–getting data into the right format, getting rid of unnecessary data, correcting spelling mistakes, etc.
- Manipulate data using Excel or Google Sheets. This may include plotting the data out, creating pivot tables, and so on.
- Analyze and interpret the data using statistical tools (i.e. finding correlations, trends, outliers, etc.).
- Present this data in meaningful ways: graphs, visualizations, charts, tables, etc. Data analysts may report their findings to project managers, department heads, and senior-level business executives to help them make decisions and spot patterns and trends.
☝️ Back to top
Types of Data Analysis
What is the key objective of data analysis? That depends on what type of data analysis skills you’re using.
Here are five kinds of data analytics.
📄 Descriptive analysis: Descriptive analytics is designed to answer the question “What happened?” The goal of descriptive analytics is to summarize data in a meaningful and descriptive manner, not to make any predictions. Examples include monthly revenue reports and KPI dashboards.
🔍 Exploratory analysis: Exploratory analysis dives a bit deeper than descriptive analytics, skimming for detectable patterns and trends in data. Another way to think of this is the initial investigation phase.
🌡️ Diagnostic analysis: Takes the insights found from both descriptive and exploratory analytics and investigates further to find the causes.
🔮 Predictive analysis: This type is often used more by data scientists, rather than data analysts. It uses data, statistics, and machine learning algorithms and techniques to figure out the likelihood of future outcomes based on data. Examples include sales forecasting and risk assessment.
🫵 Prescriptive analysis: Takes insights found from all types of data analysis (descriptive, exploratory, diagnostic, predictive) to determine the best course of action.

☝️ Back to top
Data Analysis Methods
Next, what are the methods data analysts use to accomplish these various objectives?
Here’s a quick introduction to data analysis methods.
Cluster analysis: Organizes data into groups, or clusters, that share common characteristics. More on this here: Cluster Analysis and Unsupervised Machine Learning in Python
Regression analysis: A set of statistical processes that allows you to examine the relationship between two or more variables. Learn more about this method here: Regression Analysis / Data Analytics in Regression
Factor analysis: Condenses several variables into just a few to make data analysis easier. Learn more: An Introduction to Factor Analysis
Data mining: The process of finding trends, patterns, and correlations in large data sets. Learn more: Data Mining with R: Go from Beginner to Advanced!
Text analysis: Extract machine-readable information from unstructured text (e.g., PDFs, word processing documents, emails). More on this: Text Analysis and Natural Language Processing With Python
☝️ Back to top
Why You Should Learn Data Analysis Skills
So, why is it a great idea to learn data analysis and pursue a career in this field? It seems only fitting that we look at the data to find out!
- 📈 There is anticipated job growth for data professionals: The anticipated job growth for operations research analysts (another term for data analysts) between 2022-2032 is 23%, based on data from the Bureau of Labor Statistics. That’s a significant amount of new positions being created.
- ❗ Data analytics is in demand: According to Digital Learning Academy, creators of Introduction to Data Analysis and Statistics Using SQL, “There is a demand for people who can use data to perform reporting and analysis, thus helping businesses and organizations make important and critical decisions.”
- 💰 Data roles have higher than average salaries: Data analysts are paid well even if they don’t continue on to data science or engineering! How much do data analysts make? According to Payscale, entry-level data analysts will receive an annual salary between $41,000 – $80,000 (average of $60,924). Senior data analysts can bump that up as high as $96,534.
- 💪 There is a competitive advantage: According to Ian Littlejohn, instructor of Complete Introduction to Business Data Analysis, “The ability to ask questions of your data is a powerful competitive advantage, resulting in new income streams, better decision making and improved productivity.”
- 🌎 Universal need (all kinds of companies require data help): According to Symon He and Travis Chow, instructors of Data Analysis Essentials Using Excel, “Every business generates data. But [its value] depends on your ability to process, manipulate, and ultimately translate that data into useful insights.”
Ultimately, data analysis is valuable for both organizations and individuals. You can make it a career in itself or use it as a stepping stone to other data roles.
☝️ Back to top
Popular Careers That Rely on Data Analysis
One really cool thing about gaining data analysis skills is that they don’t lock you into a single career. Sure, you could become a data analyst and stay there for decades if you love it–but there’s also the freedom to pivot in other directions if you choose.
Businesses in nearly every industry use data analytics to power decisions, gain a competitive advantage, boost sales, win new customers, improve internal operations, maximize profits, etc. This makes data analysis skills useful in many roles.
Here are some of the top jobs that involve data analysis.
1. Data Analyst
First of all, let’s look a little more at actual data analyst roles for a general explanation of how to do data analysis.
📈 What is a data analysis role?
The basics of data analysis involve retrieving and gathering large volumes of data, organizing it, and turning it into insights businesses can use to make better decisions and reach conclusions.
To share their findings with business decision-makers, an analyst (or data visualization specialist) may create charts, graphs, etc.
In short: they take worthless data and produce meaningful, actionable results.
For example, a data analyst might take an overwhelming amount of information collected from thousands of customer surveys (or look at past customer purchases, etc.), clean it up, and produce reports and visual representations of the data to pinpoint ways to improve the company’s product/increase revenues (whether it’s an app, luxury car manufacturer, supermarket, etc.)

📝 Quick facts about data analyst jobs:
- You can work in a wide variety of industries like healthcare, finance, marketing, fast food, retail IT, etc. Whatever you’re interested in!
- Average salary: $76,937
- Demand has exploded for data analysts because we’re creating more and more new data every day. For example, Google processes 40,000+ search queries every second on average (3.5M searches each day, 1.2 trillion searches per year). And this continues to climb!
- Data Analyst ranked #35 in Glassdoor’s 50 Best Jobs in America, 2022
2. Business Analyst
📈 What do business analysts do?
They identify meaningful patterns in data to drive business decisions, working closely with business VPs and senior managers.
Their duties may involve predictions, optimizations, risk management, and so forth.

📝 Quick facts about business analysis as a career:
- A business analyst is mostly concerned with the day-to-day operations of a business and how to fine-tune business processes
- Great if you’re interested in/have a background in business or finance
- Less science/math based than the traditional data analyst role
- Average salary: $84,465
3. Product Manager
📈 What do product managers do?
Product managers own and guide the success of products from conception to launch.
Each stage requires data analytics! You must analyze the market for trends and problems to solve, leverage data to determine how to improve features, and figure out how to make the product even better in subsequent versions.

📝 Quick facts about product management as a career:
- All businesses have products (services count!). This opens up a ton of possibilities as far as what industry or type of company you can work in
- Great for those coming from a customer-facing background as you can better understand users
- Average salary: $117,083
💡 Learn more about the role of a product manager in this post.
4. Digital Marketer
📈 What do digital marketers do?
Digital marketers must understand consumer habits/motivations, detect changing trends, and track performance in order to improve ads, social media campaigns, and SEO strategies.

📝 Quick facts about digital marketing as a career:
- Successful digital marketers must rely on data! Whether it’s identifying user demographics, measuring clicks and conversions to determine campaign success, or sifting through historical data to choose high-performing strategies, data is important
- Great hybrid role for someone coming from a content creation, advertising, or traditional marketing background
- Average salary: $63,758
5. Quantitative Analyst
📈 What do quantitative analysts do?
Quantitative analysts (“quants”) are data analysis professionals who work in the financial industry, leveraging data and data models to manage risk, predict changes in the valuation of stock and bonds, and make data-driven investment decisions.

📝 Quick facts about quantitative analysis as a career:
- Great if you love math!
- Perfect role for someone who can’t decide between tech and finance
- Usually requires a master’s degree in a related field
- Average salary: $141,966
☝️ Back to top
Top Data Analytics Tools
So what are the top data analytics tools you should know? The most commonly used tools include:
Knowing these is often enough to get your foot in the door for a data analyst position.
However, keep in mind that some companies and roles may require you to know languages like Python or R, and Jupyter Notebooks for interactive coding and visualization. Additionally, understanding basic concepts of big data processing using tools like Apache Hadoop and Spark can be beneficial.
“The job can vary a LOT from role to role,” says one Redditor. “For higher paying data analyst roles I would say at least some script language programming (R, Python, etc) is necessary. But there are plenty of data analysts where just SQL and Excel should be enough.”
☝️ Back to top
How to Learn Data Analytics for Beginners: 5 Key Skills & Courses
Beyond great problem solving, communication, and creativity skills, you’ll also need some specific tech skills to succeed at data analysis.
Each of the data analysis skills below will build on the next, so don’t worry about learning everything at once. There are some you can learn right now through data analyst courses on Udemy, and others you can learn and improve on the job.
Here are the most common skills/tools you’ll need to get a career in data analysis or grow your data analysis skills to help in another role! Plus, the data analytics courses where you can start learning them.
Please note that pricing listed below may change in the future!
Data Analysis Skill #1: Excel (Spreadsheets)
What it is: Microsoft Excel is a spreadsheet program that allows you to perform complex data analysis. Excel’s built-in pivot tables are one of the most popular analytic tools.
Why learn it: According to Diego Fernandez, instructor of Excel for Data Analysis: Basic to Expert Level, “Learning Excel is essential for any professional or academic career based on data analysis. It is the most commonly used data analysis software both professionally and academically and it’s a solid foundation before learning any other.”
Data analysis course for beginners: Microsoft Excel – Data Analysis with Excel Pivot Tables

What this data analysis course covers: You’ll learn the Excel skills to take you from zero to pro with Excel’s most powerful data analysis tools.
➡️ Course URL: https://www.udemy.com/data-analysis-with-excel-pivot-tables/
👋 Instructed by: Chris Dutton
💰 Price: $199.99
🎓 Students enrolled: 233,031
📈 Skill level: Beginner
💡 What you’ll learn: Excel, including PivotTables & PivotCharts
✅ Course includes:
- 6 hours on-demand video
- 6 supplemental resources
- Full lifetime access
🎤 What past students say:
“This is a great course. You can feel confident putting this skill on your resume after taking this course. The lectures are in-depth and easy to follow. I would highly recommend this course to anyone who wants to not just learn PivotTables, but become a true expert.” – Monique Chin
Data Analysis Skill #2: SQL (Database Language)
What it is: SQL (Structured Query Language) is a language used to interact with databases that store data, allowing us to retrieve data quickly and easily.
Why learn it: SQL allows you to perform operations on millions of rows of data. It’s the 2nd most in-demand skill for data analysis jobs (only after data analysis itself!)
Data analysis course to take: SQL for Newbs: Data Analysis for Beginners

What this data analyst course covers: You’ll learn real-world SQL (not just the theory in abstract, but real skills you can start using immediately), as well as how to find actionable customer/business insights and make data-driven decisions.
➡️ Course URL: https://www.udemy.com/sql-for-newbs/
👋 Instructed by: David Kim & Peter Sefton
💰 Price: $124.99
🎓 Students enrolled: 72,617
🌟 Fun fact: This course has been taken by marketing employees at Google, Facebook, Amazon, Lyft, and Udemy!
📈 Skill level: Beginner
💡 What you’ll learn: SQL, including MySQL
✅ Course includes:
- 3.5 hours on-demand video
- Full lifetime access
- 5 bonus lectures
🎤 What past students say:
“Very understandable and practical. Was able to do some real world use cases at my work after first couple of lessons. Wonderful intro to SQL with very engaging instructors. Cudos!” – Rimvydas Jančiauskas
Data Analysis Skill #3: R (Programming Language)
What it is: R is a programming language for statistical computing and graphics. It is widely used among statisticians, data miners, data analysts, business analysts, and data scientists for developing statistical software, data analysis, machine learning and so on.
Why learn it: According to Arpan Gupta, instructor of R Programming for Data Analysis & Data Visualization, “R gives aspiring analysts and data scientists the ability to represent complex sets of data in an impressive way.” R has been adopted by many high-profile companies like Google and Facebook as the language of choice to analyze data.
Data analysis course to take: Applied Statistical Modeling for Data Analysis in R

What this data analytics course covers: It provides a robust foundation to carry out practical, real-life statistical data analysis tasks in R, one of the most popular and free data analysis frameworks.
➡️ Course URL: https://www.udemy.com/applied-statistical-modeling-for-data-analysis-in-r/
👋 Instructed by: Minerva Singh
💰 Price: $109.99
🎓 Students enrolled: 11,359
📈 Skill level: All levels
💡 What you’ll learn: R for statistical data analysis and visualization tasks for data modeling
✅ Course includes:
- 9.5 hours of lectures
- 41 Supplemental Resources
- Full lifetime access
🎤 What past students say:
“Everything you need is here in clear, concise value-packed content.” – Vladimir Vitch
Data Analysis Skill #4: Data Visualization
What it is: Data visualization helps key decision-makers in a business (usually non-tech senior execs) see analytics presented visually in graphs, charts, etc. so they can identify trends and patterns and understand complex information.
Why learn it: If you are creative, this may be the perfect skill to learn. Learning data visualization can give you an edge over other job applicants since employers are looking for people who understand both the science and art behind data analysis.
Data analysis course to take: Introduction to Data Visualization
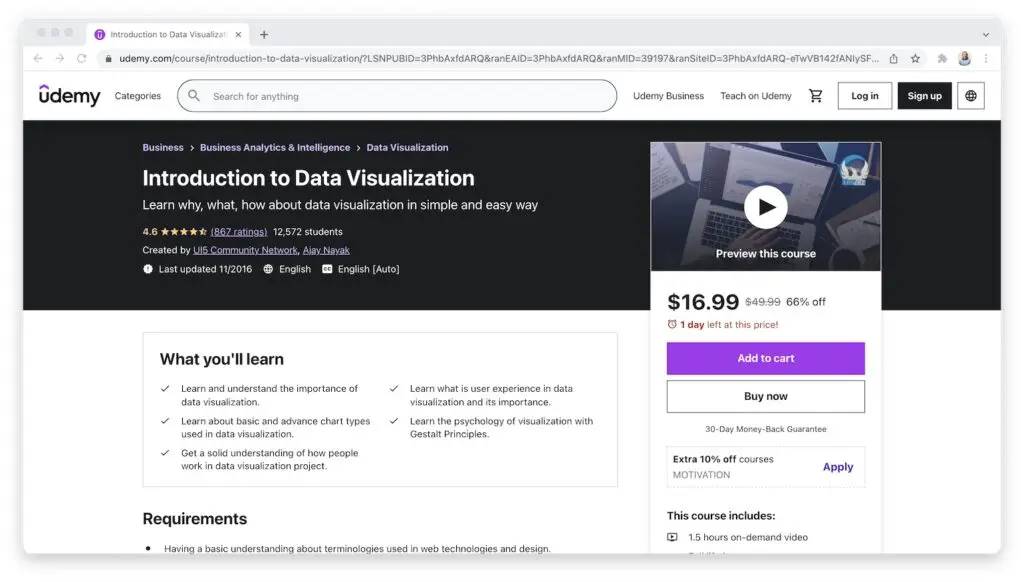
What this data analyst course covers: Everything you need to start your own data visualization project, including basic and advanced chart types and the psychology of visualization with Gestalt Principles.
➡️ Course URL: https://www.udemy.com/introduction-to-data-visualization/
👋 Instructed by: Ajay Nayak
💰 Price: $24.99
🎓 Students enrolled: 12,765
📈 Skill level: Beginner
💡 What you’ll learn: All of the key aspects of data visualization
✅ Course includes:
- 1.5 hours on-demand video
- Full lifetime access
🎤 What past students say:
“Really good! Concise and very clear! If you’re not familiar with data visualization, want to learn and don’t know where to start, start here and take this course!” – Sandy Putranto
Data Analysis Skill #5: Power BI
What it is: Microsoft Power BI is a tool that allows you to create interactive, immersive dashboards and reports.
Why learn it: It’s an in-demand skill that helps you share results, reports and dashboards with non-tech people at a company.
Data analysis course to take: Microsoft Power BI – The Practical Guide 2024

What this data analyst course covers: In this course, you’ll get to know the different tools of the Power BI universe and learn how to use them to create data dashboards and visualizations.
➡️ Course URL: https://www.udemy.com/course/powerbi-complete-introduction/
👋 Instructed by: Manuel Lorenz
💰 Price: $124.99
🎓 Students enrolled: 277,690
📈 Skill level: Beginner
💡 What you’ll learn: How to use Power BI to analyze data and create and publish nice-looking charts in just a few minutes.
✅ Course includes:
- 17.5 hours on-demand video
- 6 articles
- 19 downloadable resources
- Full lifetime access
🎤 What past students say:
“This is a very good course to learn PowerBI. The explanation of the teacher is very clear, the pace of the lectures is easy to follow. I am very pleased with the course. I can recommend this course to anyone who likes to learn PowerBI.” – Menno V.
More Data Analytics Skills to Consider Learning
These skills will also give you a leg up in data analysis roles:
- Google Sheets (basically the cloud version of Excel)
- Tableau (you can download a free version to get started!)
- Data Studio (Google’s free data visualization tool)
- Google Analytics/Google AdWords
- College algebra math skills (linear algebra and multivariable calculus will give you a competitive advantage, but it’s by no means required to land a data analysis job)
- Basic understanding of machine learning (you don’t need to know how to invent new algorithms, just the basic foundation of machine learning). Learn more about machine learning here.
If you’re interested in going to school, typical college majors of data analysts include business, economics, statistics, and computer science.
More Data Analysis Courses for Beginners
Beyond the skills above, you can also learn data analytics with these beginner-friendly courses:
- Beginner’s Guide to Data & Data Analytics, by SF Data School
- Data Analysis & Visualization Bootcamp
- Beginner Statistics for Data Analytics – Learn the Easy Way!
- Data Analysis Essentials Using Excel
- Data Analysis Bootcamp™ 21 Real World Case Studies
- Become a Data Analyst Nanodegree
☝️ Back to top
FAQs About Data Analysis
Let’s wrap up with a few common questions and answers about learning data analytics!
Is data analysis the same as data analytics?
The terms “data analysis” and “data analytics” are often used interchangeably, but there is a small distinction.
Data analytics is a term usually used to refer to the broad field of using data to make business decisions — it’s a term referring to a discipline. Data analysis, meanwhile, is a subset of data analytics and is a term used to describe the process of gleaning insights from data. That said, data analyst jobs tend to fall under both umbrellas.
Is data analysis hard?
The great thing about data analysis is that it’s more of an entry-level role, meaning you can jump right in with basic knowledge after you take some data analysis courses for beginners and sharpen a few key skills. (Of course, it certainly won’t hurt if you already have experience with coding, math, or statistics!)
Data analysis is typically easier than data science, since it doesn’t usually require advanced programming skills or advanced math.
Whether or not data analysis is hard depends on your natural abilities (i.e., are you good with numbers? Are you a natural problem-solver?), any transferable skills you’ve learned from previous careers and more. Overall, when compared to other tech roles, data analysis is often easier to break into.

Why is data analysis important?
Data analysis is important because without it, companies would be facing mountains of data with no way to make any sense of it. Data analysis helps businesses improve and optimize based on the past. This leads to better profits, more customers, a reduction in errors, more efficient practices, etc.
What are the top data analysis skills needed?
Skills needed for a career in data analysis include: Excel, SQL, data visualization, and sometimes R/Python. Other companies may require their data analysts to know Power BI and Tableau.
Do you need to be good at math?
While math is more of a requirement for data science jobs, there is still some math need for a data analysis role. You’ll often need a foundational knowledge of mathematics and statistics, but often just at the high school level.
If you’re interested in a career in data science, you’ll need to level up those math skills. Check out Become a Probability & Statistics Master if you need a refresher.
Do data analysts code?
It depends! Some data analyst work may require coding knowledge, while others jobs may mostly just require knowledge of Excel.
According to this Redditor: “Honestly it depends on where you work and the kind of analysis you’re doing. A good chunk of the work I do wouldn’t be possible without SQL + Python/R. I’ve been in roles and seen jobs that were almost entirely excel based.”
Another Redditor says “Every company is different, but data analysts will mostly be fine with SQL, Excel, and a BI tool (Tableau, Looker, Qlik, etc.).”
Do I need a degree to be a data analyst?
Definitely not! What really matters is your skillset. If you can show an employer that you know how to use Excel, SQL, Power BI and maybe even Python or R, they likely won’t care if you don’t have a formal degree.
☝️ Back to top
So, What Is Data Analysis? It’s The Future!
Today’s companies are being flooded with data, and they desperately need data analysts capable of making sense of it for them. As the Internet of Things comes into its own, those needs will only multiply.
The big data technology market is expected to reach $116.07 billion by 2027. Additionally, the number of hired data analysts is expected to grow by 25% from 2020 to 2030.
Large global companies are already appointing Chief Data Officers (CDOs), showing the extent to which they’re taking data management seriously. Someone who starts pursuing a data career today could be in a very lucrative position in very little time.
If you’re unsure about which direction to take in tech, it’s a good idea to learn data analytics as a starting point.