Several weeks ago, I sent out a survey to learn more about you, your habits, and your goals as you teach yourself to code.
I received an amazing response, and I’m sharing those answers with you today.
The 15-question survey was taken by 507 participants. It was sent to people on the Learn to Code With Me (LTCWM) email list and posted on social media. For more about the survey itself, visit the bottom of this article to view the methodology (as well as the chance to view the full report!).
Summary of the findings
- Majority of the respondents were between 25-34 years old (42.6%)
- Almost evenly split between men and women; however slightly more male respondents (52.1%)
- More than half of the survey participants came from the US (53.1%)
- Majority of respondents were college educated or higher (59.1%)
- Majority of respondents were employed full-time (49.3%)
- Most would ideally be employed full-time (40%) followed by freelance (34%)
- More respondents hoped to pursue web development than any other path (46.4%)
- Survey participants cited (1) better career and (2) increased flexibility as their primary reasons for learning to code
- They struggled most with (1) finding time followed by (2) maintaining motivation
- Nearly half (49.9%) had been teaching themselves for 6 months or less
- Over 50% of survey-takers said they prefer online courses over other methods of learning
- About 40% said they spend 0-5 hours every week learning, followed by 5-10 hours weekly
- 31% said they had spent between $1-$100 so far; 30.6% said they have spent $0
- The vast majority use Chrome as their primary browser (75.7%)
- Slightly over half use Windows as their operating system (54%)
How participants answered each question
Here’s a breakdown of how the 507 respondents answered each question.
Question #1: What age group are you in?
As you can see, 25-34 is the largest age group. In fact, those that are millennials (between ages 18-34) makeup 341 of total respondents (67.3%).

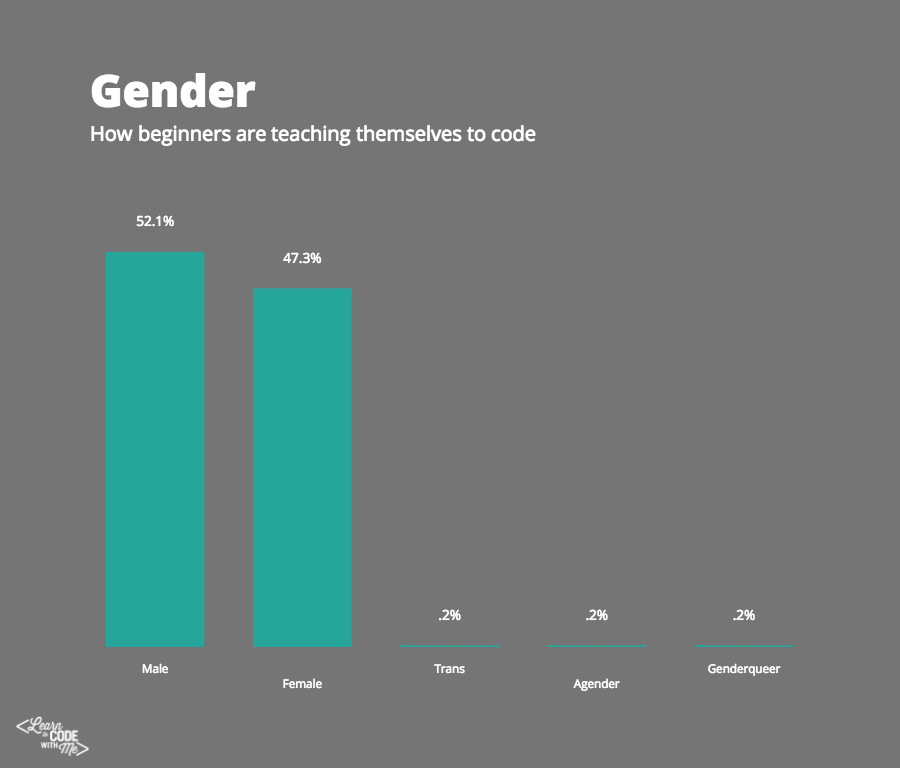
Question #2: Which gender do you identify with?
Those who identify as male and female were almost equal; however, male is the largest group by a slight majority. (264 men versus 240 women.)
Question #3: Which country are you from?
Majority of 507 survey respondents come from the US (269 people).

A few of the “other” countries include: Bangladesh, Nigeria, Sweden, Vietnam, Costa Rica, Czech Republic, and over 30 more.
Question #4: What has been the highest level of education you completed?
Most of the 507 respondents are college graduates or higher. Precisely, 330 people (65%).
Only 15 people (3%) marked “some high school,” half of which indicated that they were under 18 years old.

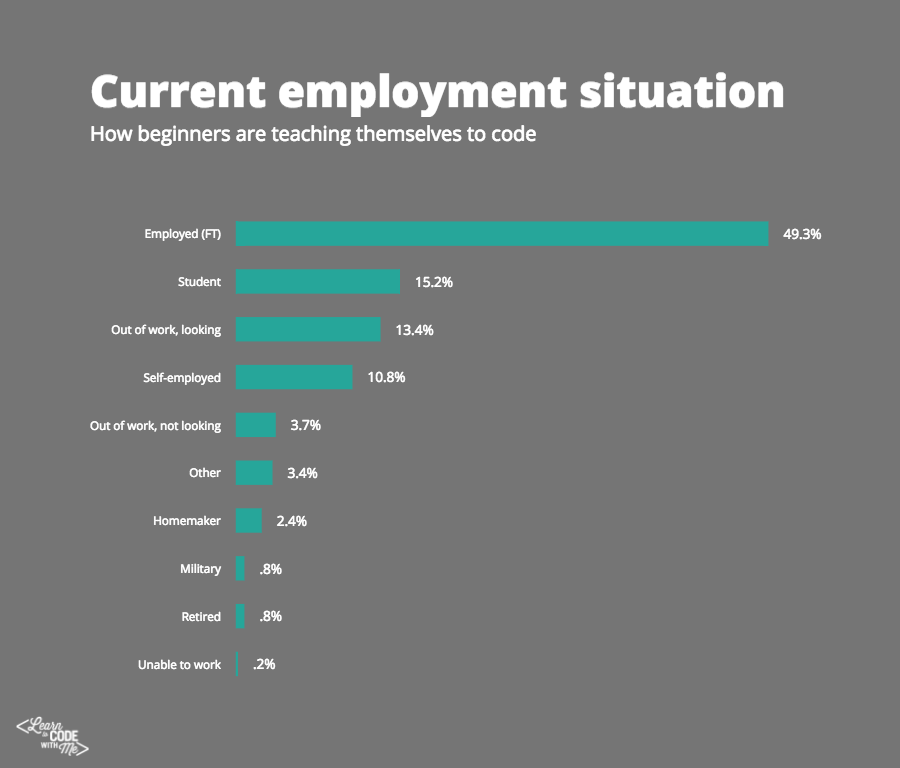
Question #5: What is your current employment situation like?
Most of the 507 respondents are currently employed full-time, followed (far behind) by students.
Moreover, only 10.8% of the survey-takers said they are self-employed.
Question #6: What does your ideal employment situation look like?
Most people want to work full-time, followed closely by freelancing.
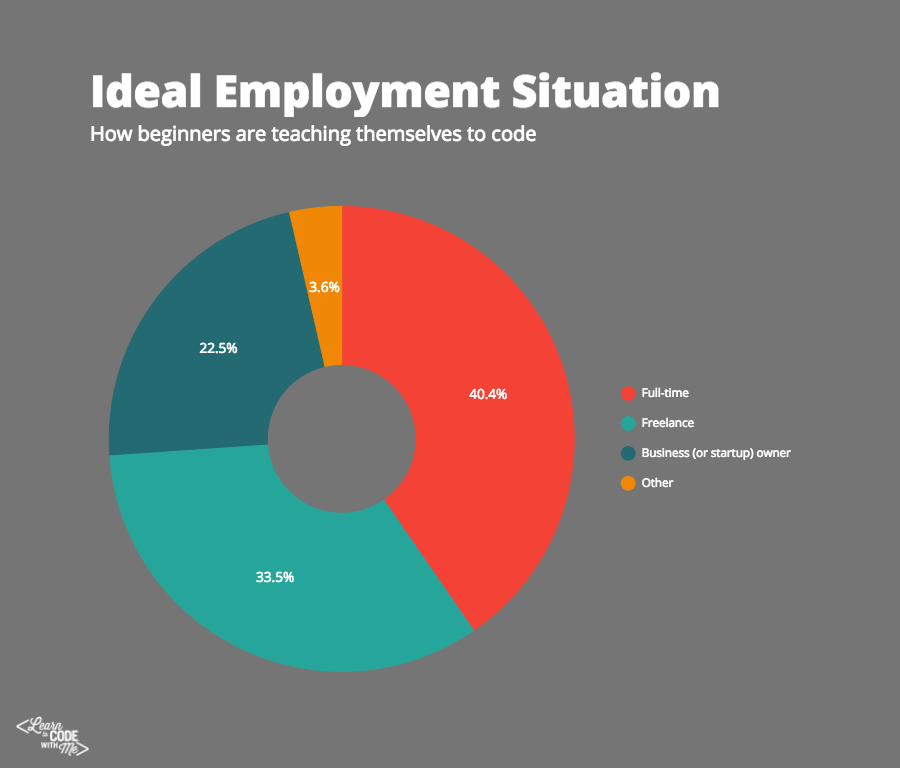
However, out of those who took the survey who are 45 years or older, only 26.4% said they desire to work full-time. Meanwhile, 43% said they would like to freelance.
What’s interesting is how many people are currently employed full-time that want to freelance or work for themselves in some way.
Question #7: What career would you like to pursue in tech?
Majority of 507 respondents want to pursue web development, followed far behind by web design.
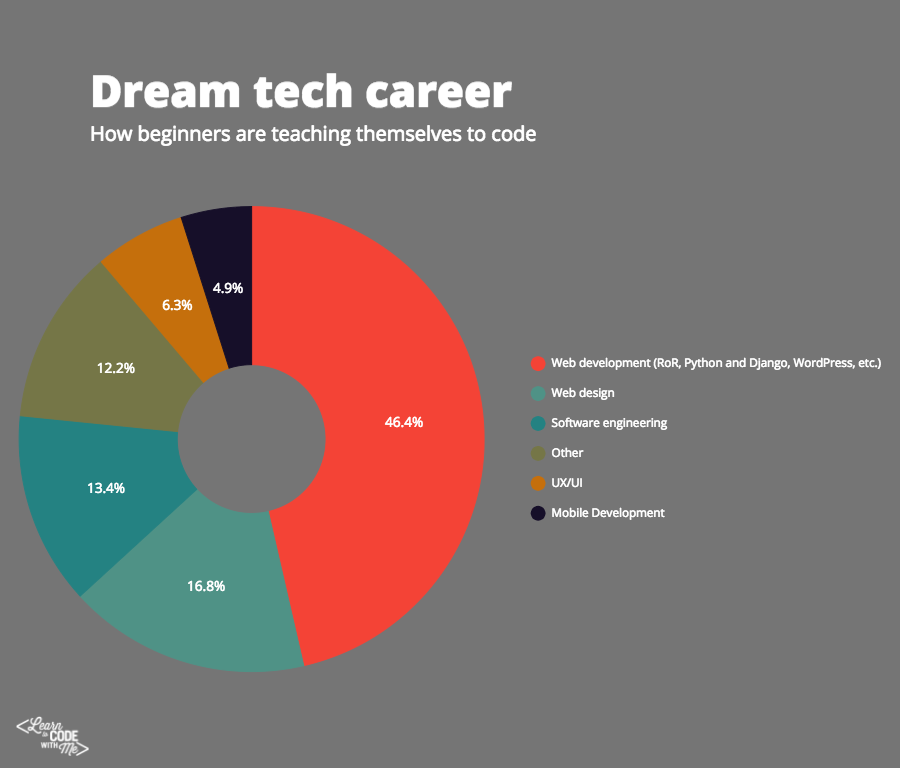
What’s interesting is that out of the people who want to pursue web development, it is very evenly split between genders.
However for a few of the other careers, gender difference were noticeable. For instance, out of the 85 people who want to pursue web design, 62.4% are women. And then out of the 69 people who want to pursue software engineering, 72.1% are men.
Question #8: Why are you learning how to code?
Most people are learning to code because they desire a better career, followed by increased flexibility in their day-to-day.
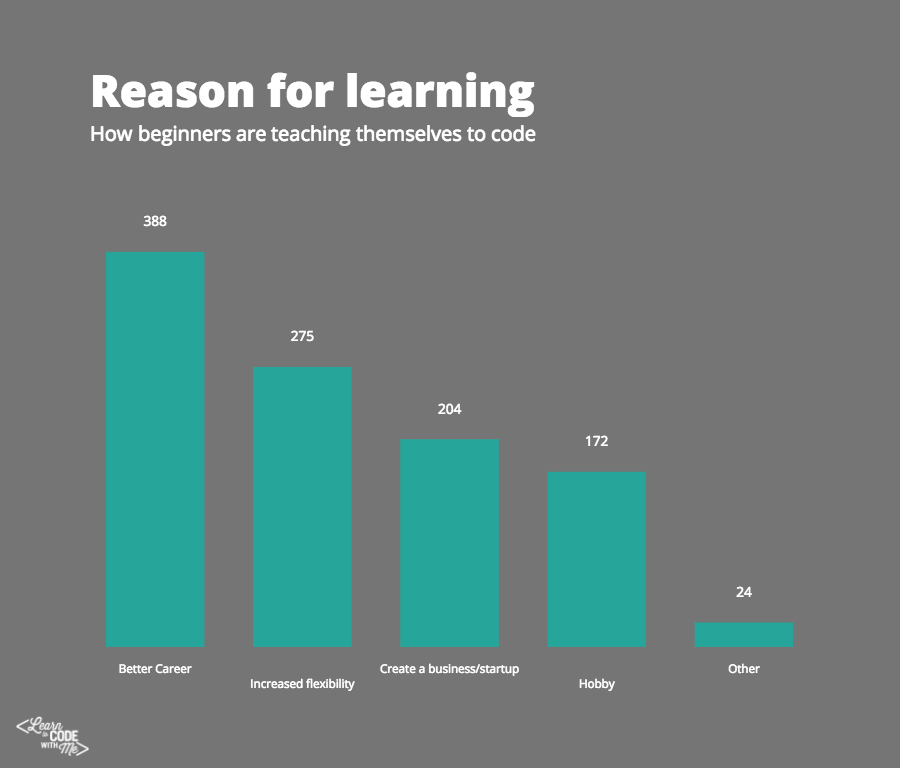
(Note: the numbers above represent how many people selected that option. For this question, participants were able to select more than one response.)
Question #9: What is the hardest thing about learning how to code?
However, their major struggle when learning is finding time to do so, seconded by maintaining motivation.

(Note: the numbers above represent how many people selected that option. For this question, participants were able to select more than one response.)
Question #10: How long have you been teaching yourself how to code?
Out of the 507 survey-takers, 372 people (73.4%) said they have been learning to code for one year or less.
Only 74 people (14.6%) have been learning for two years or more.

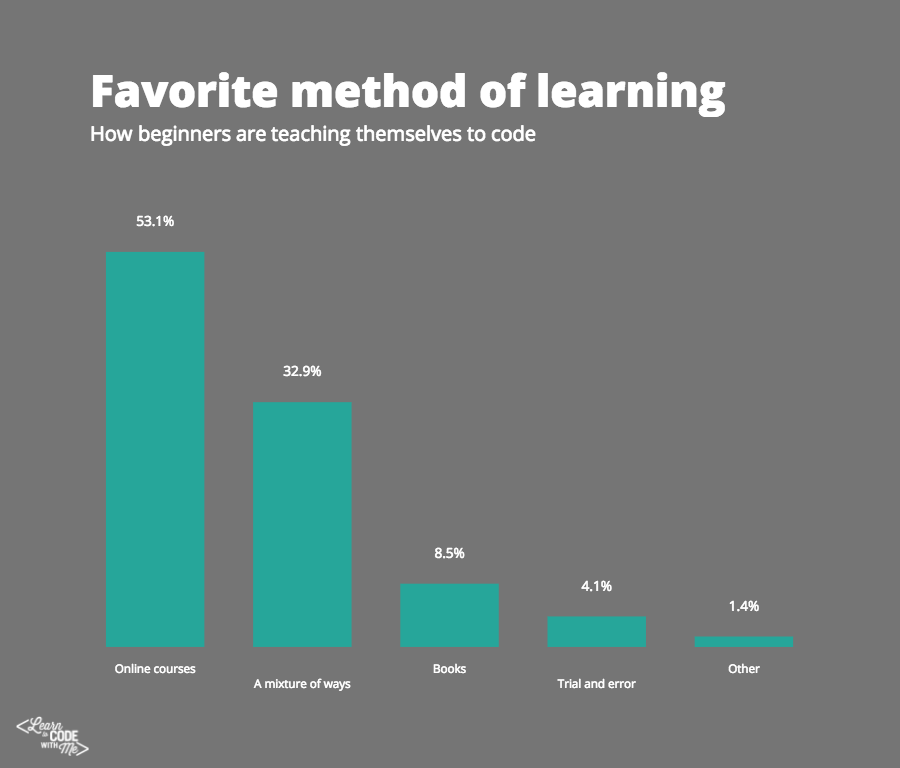
Question #11: What is your favorite way to learn?
Most people said they prefer online courses as their primary education method.
Interestingly, no one under the age of 18 said “books” was their preferred way to learn. Moreover, no one over the age of 54 (or under the age of 18, for that matter) said “trial and error” was their favorite way.
Question #12: How many hours do you spend per week learning?
Most of the participants spend 0-5 hours learning every week, followed by 5-10 hours. Only 46 people (9.1%) spend 20 hours or more learning every week.
Essentially, people learn on a very part-time basis. More than half of the survey-takers (68.6%) said they spend less than 10 hours learning every week. Given the fact many have full-time obligations, this is not surprising.

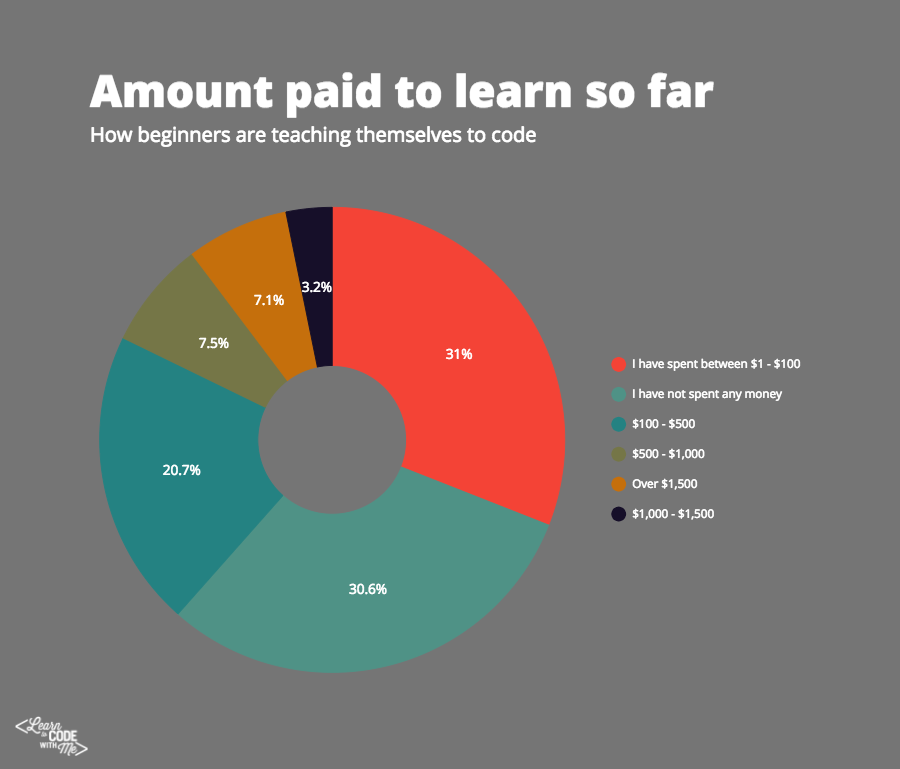
Question #13: How much money have you spent so far to learn to code?
The majority of people have spent $100 or less so far. Realize, this low price point could be due to the fact that most respondents have not been learning very long.
Only 90 people have spent $500 or more while learning to code. To break down the numbers:
- 38 have spent between $500 – $1,500
- 16 have spent between $1,000 – $1,500
- 36 have spent $1,500+
Interestingly enough, of those last 36, over 60% were women.
Most people who spent over $1,500 have either been learning for a longer time…or are probably attending more expensive learning programs or even in-person bootcamps.
Still, lots of people learn to code for free, without paying anything.
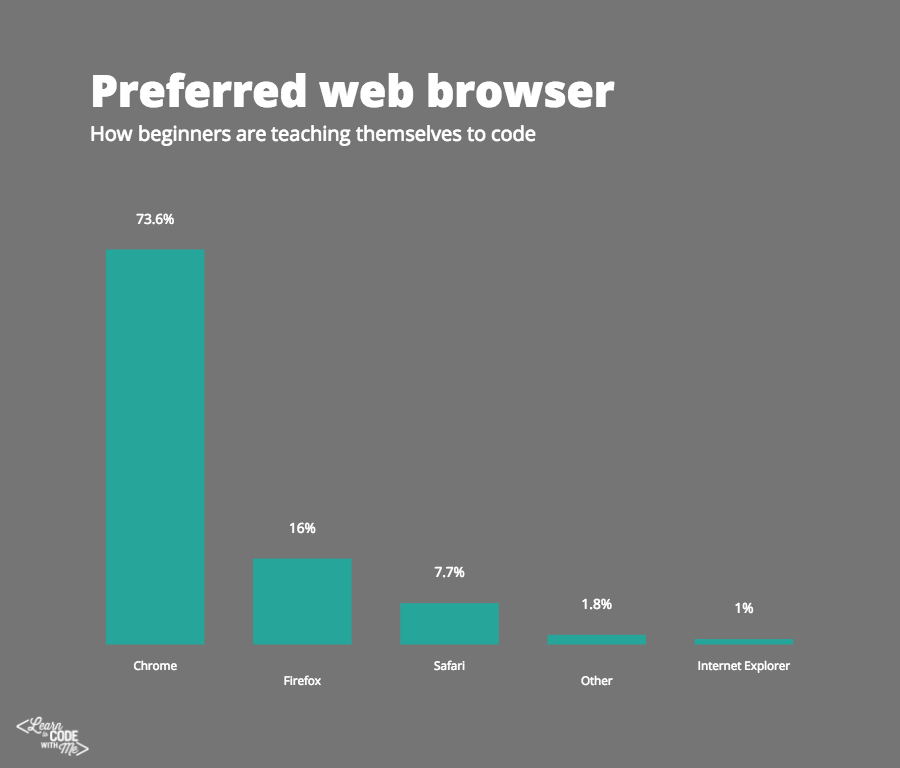
Question #14: Which web browser do you most often use?
The vast majority of 507 respondents said they use Chrome as their primary browser (373 people).
Out of the 1.8% who selected “Other,” the most popular “Other” browser was Opera.
Despite all the jokes about Internet Explorer, 1% of survey respondents use Internet Explorer. (Which comes out to 5 people.)
However, when you look at browser usage worldwide:
- 43.95% use Chrome
- 13.39% use Safari
- 12.18% use Internet Explorer
So when compared to the rest of the world, LTCWM readers use Chrome more than average, and Internet Explorer less than average.
Question #15: Which operating system do you most-often use?
274 people (54%) say they use Windows as their operating system.
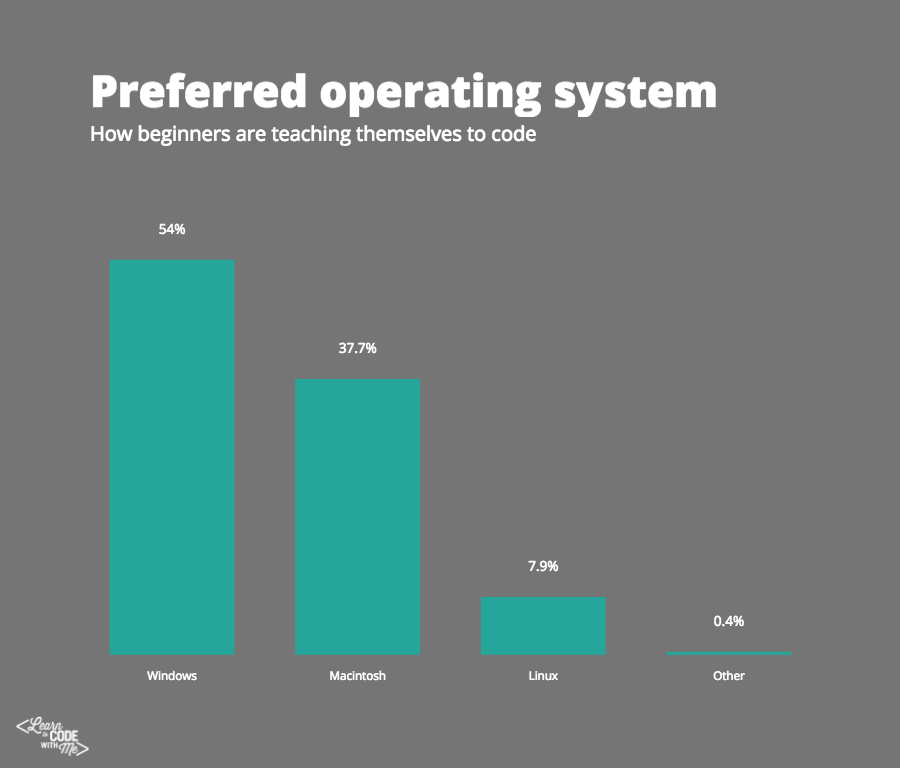
It may seem like a lot… but 54% is significantly less than global averages.
When you look at worldwide usage trends, 87.85% of people are Windows users (on one version or another; however, most using Windows 7).
On the other hand, only 8.18% of people in the world use Mac compared with the astounding 37.7% of survey-takers.
Survey Methodology
Data was self-submitted by LTCWM readers between 10/5/2015 – 10/9/2015. People have taken survey since then, but we are only looking at the first 507 responses.
Most of the submissions came from the LTCWM email list, followed by fans of the LTCWM Facebook page, and members of the now-defunct Learn to Code With Me Community, formerly Newbie Coder Warehouse Facebook group.
The survey was 15 questions, all multiple choice. However, many of the questions allowed survey-takers to fill in responses for “Other”.
Moreover, two questions, “Why are you learning how to code?” and “What is the hardest thing about learning how to code?” allowed respondents to select more than one answer.
Following the survey distribution, all data was analyzed in Google Sheets.
Conclusion
If you participated in this survey, thank you! This article wouldn’t have been possible.
Either way, I hope you enjoyed learning more about your fellow LTCWM readers. Based on the findings from this survey, here’s a quick picture of what they might look like:
- Millennials (18-34)
- From the US
- Currently employed full-time
- Want to pursue web development
- Like to learn via online courses
- Spend less than 10 hours a week learning
- Have spent $100 or less to learn thus far
- Use Chrome as their browser
If you want to find out more about the people who took the survey, make sure to download the in-depth report below.
When you’re done checking out the report, make sure to let me know what you thought about the findings by leaving a comment below.